
Infographics are one of the easiest ways to turn complex information into something fun, simple, and easy to understand. Whether you’re a blogger, marketer, teacher, or business owner, infographics help you share your message in a way that grabs attention fast.
Instead of writing long paragraphs, you can use visuals like charts, icons, and graphics to explain your point — and the best part? People are more likely to remember it too!
But here’s the thing: not everyone is a designer, and creating infographics from scratch can feel overwhelming.
That’s where infographic maker tools come in.
These tools make it super easy to design professional-looking infographics in just minutes — even if you have zero design skills. Most of them offer drag-and-drop features, ready-made templates, and thousands of design elements to help you bring your ideas to life.
In this guide, we’ll take a look at the best infographic maker tools you can use right now — covering their top features, pros and cons, pricing, and what makes each one special. Whether you’re creating content for social media, reports, presentations, or your website, you’ll find the right tool here.
Let’s dive in!
What to Look for in an Infographics Maker Tool
With so many infographic tools out there, it can be tricky to know which one is right for you. Some are great for beginners, while others are built for professionals who want more control. Before you choose, here are a few important things to keep in mind:
1. Easy-to-Use Interface
Look for a tool that’s beginner-friendly with a simple, drag-and-drop editor. You shouldn’t need design experience to make something that looks great. If it feels confusing or takes too long to learn, it’s probably not the right fit.
2. Ready-Made Templates
Templates save you a lot of time. The best tools offer a wide variety of infographic templates — for business reports, timelines, comparison charts, process flows, and more. Make sure the tool has templates that match your style and purpose.
3. Customization Options
A good tool lets you fully customize your design — from changing colors and fonts to resizing icons and rearranging elements. This is especially important if you want your infographic to match your brand or personal style.
4. Charts and Data Visualization
If you’re working with numbers or data, make sure the tool supports charts and graphs. Some tools also let you import data from Excel or Google Sheets to save time and reduce errors.
5. Export & Download Options
Check the download formats. Can you export in PNG, JPG, PDF, or even interactive formats? High-resolution export options are great if you want to print your infographic or include it in a presentation.
6. Collaboration Features
If you’re working with a team or need to share your design for feedback, tools with real-time collaboration or sharing options come in handy. This is especially useful for marketing teams, agencies, or educators.
7. Free Plan or Trial
Most tools offer a free version or trial. This lets you test things out before paying. Make sure the free plan gives you access to enough features to decide if it’s worth upgrading.
8. Integration with Other Tools
Some infographic makers integrate with tools like Google Drive, PowerPoint, social media platforms, or design software. These integrations can help speed up your workflow.
9. Value for Money
Finally, look at what you’re getting for the price. Some tools are very affordable with lots of features, while others might be pricey but offer professional-grade options. Pick the one that fits your needs and budget.
List of Best Infographics Maker Tools in 2026
| Tool Name | Best For | Free Plan | Starting Price | Standout Feature |
|---|---|---|---|---|
| Canva | Beginners & teams | ✅ | $12.99/month | Huge template library |
| Venngage | Infographic-focused users | ✅ | $19/month | Strong charting tools |
| Piktochart | Data-heavy visuals | ✅ | $14/month | Easy data import |
| Visme | Interactive content | ✅ | $12.25/month | Animations + interactive charts |
| Adobe Express | Fast, simple designs | ✅ | $9.99/month | Integrated with Adobe ecosystem |
| Infogram | Data + charts | ✅ | $19/month | Real-time data updates |
| Snappa | Quick social visuals | ✅ | $10/month | Very simple interface |
| Easel.ly | Students & teachers | ✅ | $5/month | Affordable + beginner-friendly |
| Mind the Graph | Scientific visuals | ✅ | $9/month | Science-focused illustrations |
| DesignCap | General design needs | ✅ | $4.99/month | No login needed to start |
Canva
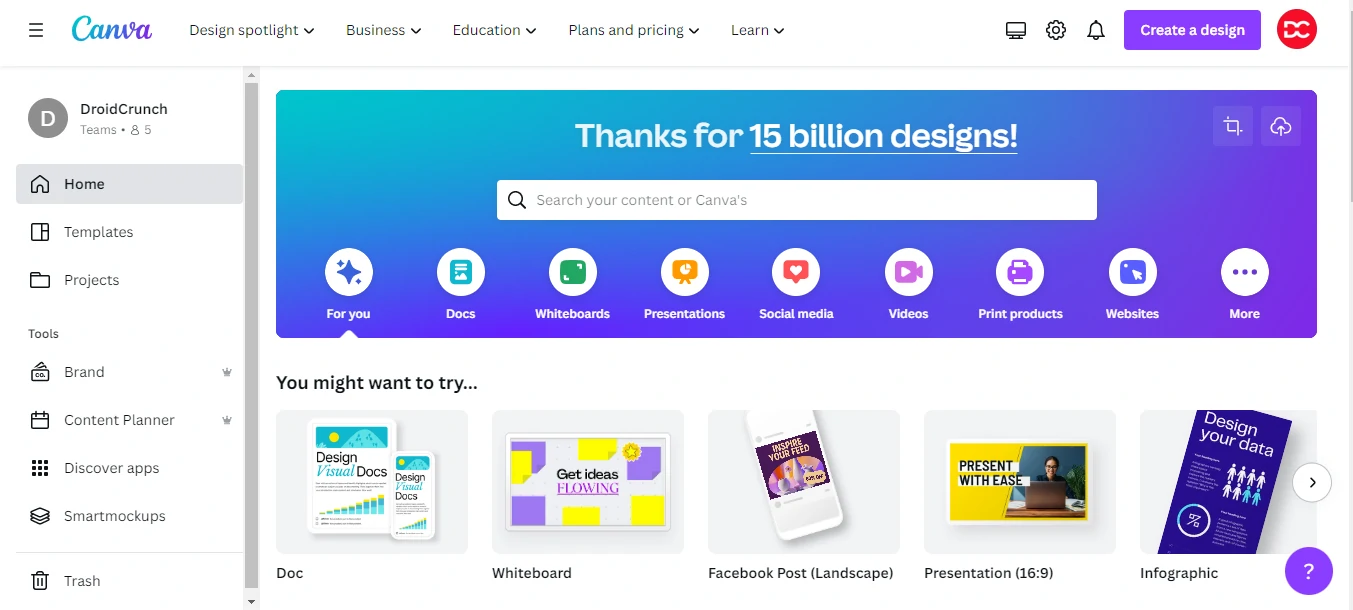
Canva is a popular design tool with a drag-and-drop editor and thousands of templates. It’s perfect for creating infographics, social media graphics, and more — no design skills needed.
Ideal for beginners, teams, and content creators looking for fast, good-looking visuals with easy customization and branding features.
Pricing:
- Free Plan: Yes
- Pro Plan: Starts at $12.99/month
2. Venngage
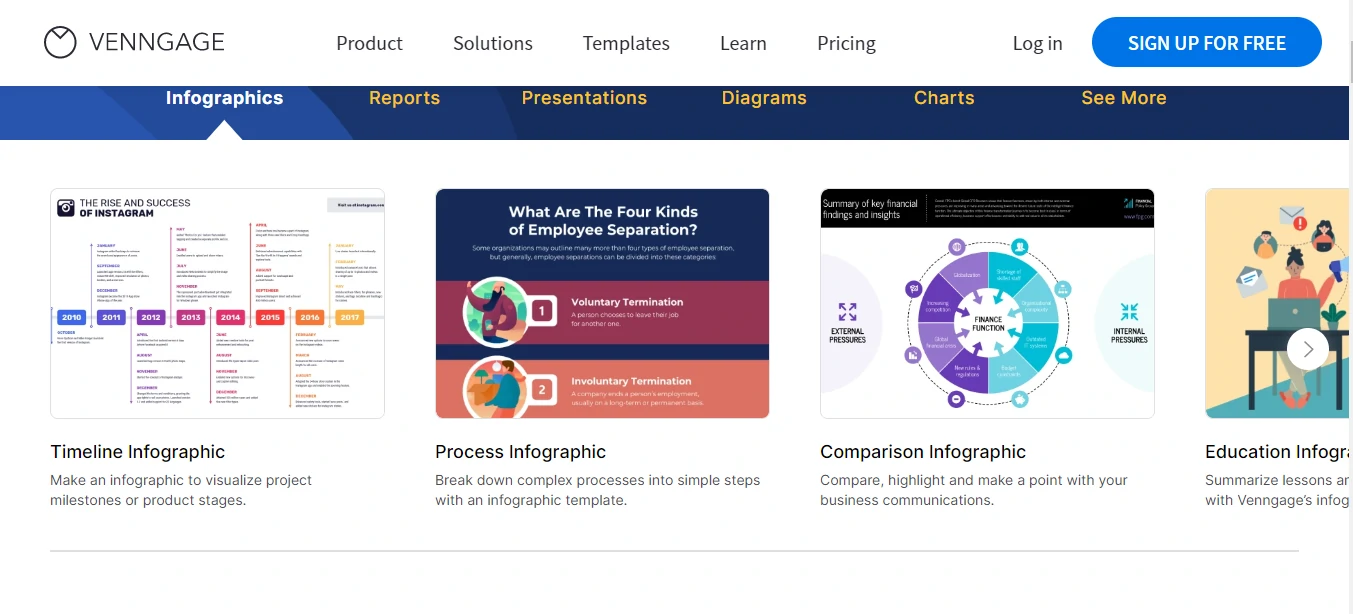
Venngage is built specifically for infographics, offering professional templates for timelines, reports, and data visuals. It’s great for educators, marketers, and business professionals who need clear and stylish visuals.
With strong chart tools and easy customization, Venngage is a smart pick for infographic-focused work.
Pricing:
- Free Plan: Yes (limited access)
- Premium Plan: Starts at $19/month
- Business Plan: Starts at $49/month
3. Piktochart
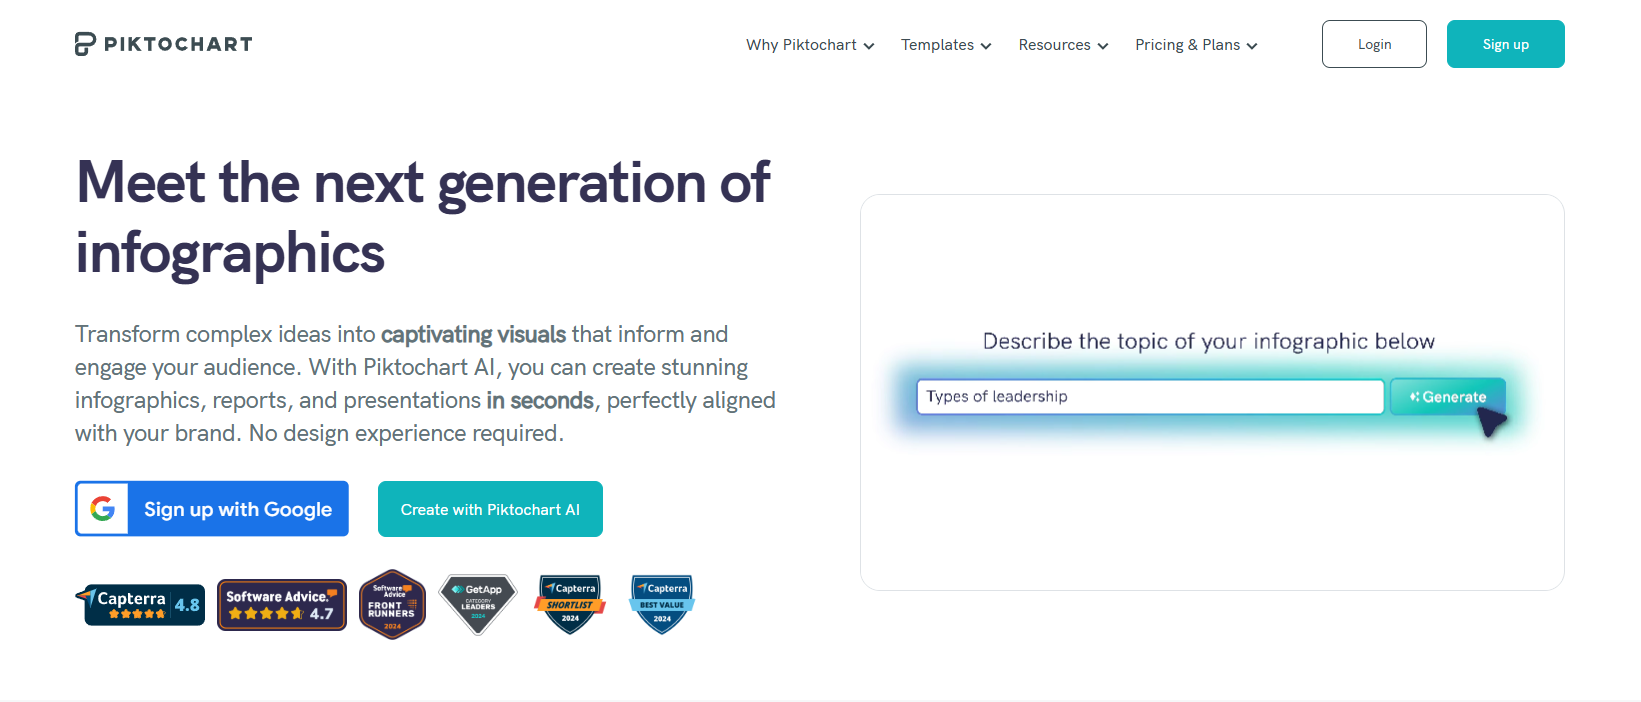
Piktochart helps you turn boring data into clean, eye-catching infographics, reports, and presentations.
With easy data import, ready-to-use templates, and strong visuals, it’s perfect for professionals who deal with charts, summaries, and business visuals regularly. Simple, fast, and focused on clarity.
Pricing:
- Free Plan: Yes
- Pro Plan: Starts at $14/month
4. Visme
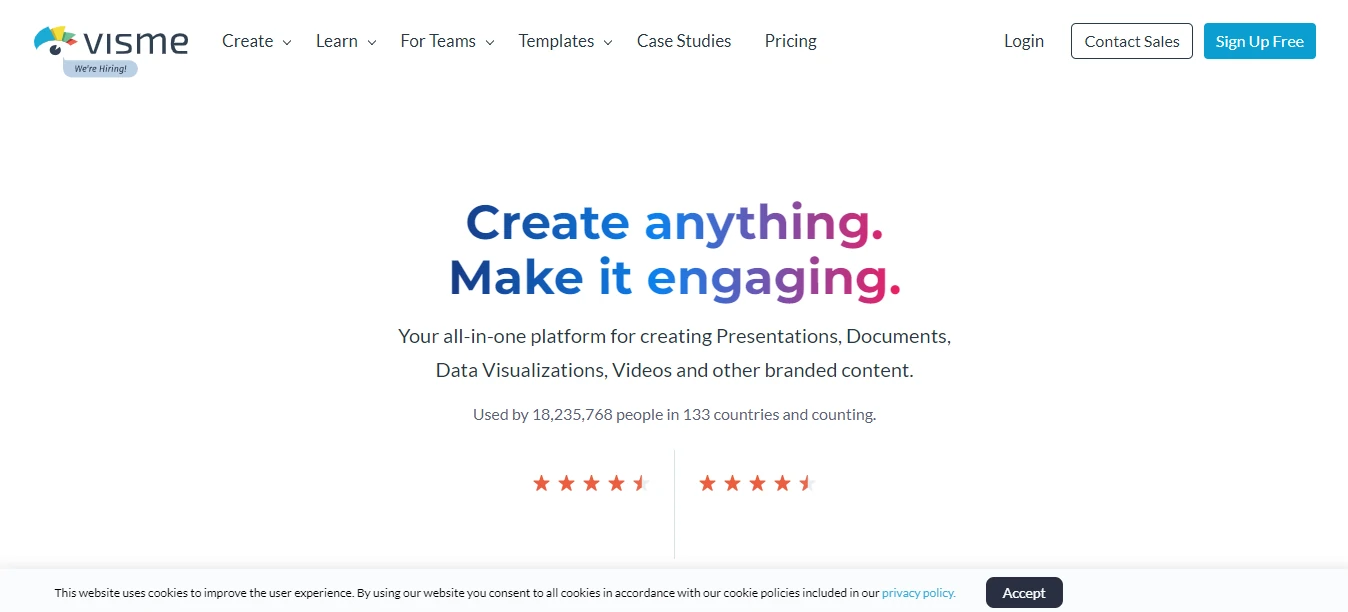
Visme is an all-in-one tool for creating interactive infographics, presentations, documents, and reports. It offers animations, charts, maps, and drag-and-drop editing.
Great for content creators and businesses looking to build engaging, data-rich designs that stand out online or in presentations.
Pricing:
- Free Plan: Yes
- Standard Plan: Starts at $12.25/month
- Business Plan: Starts at $24.75/month
5. Adobe Express
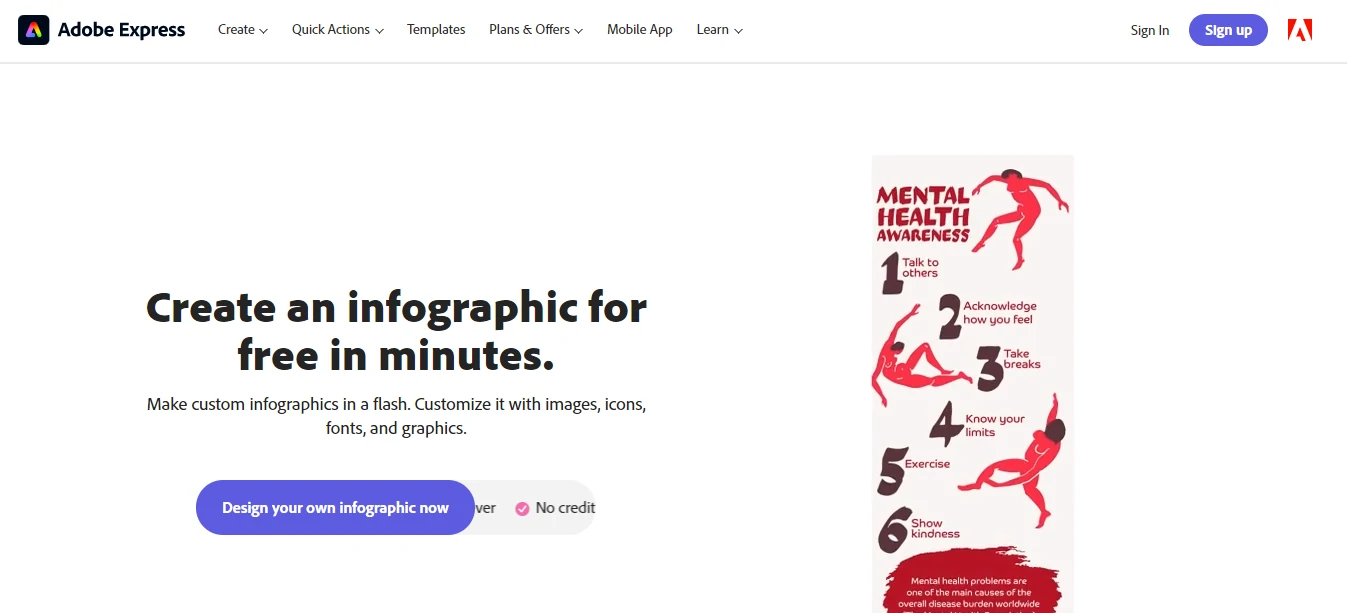
Adobe Express is a beginner-friendly design app that helps you create beautiful infographics and visuals quickly. It offers templates, stock images, and Adobe Fonts.
It’s ideal for users who want quality results with minimal effort, especially for social media and lightweight projects.
Pricing:
- Free Plan: Yes
- Premium Plan: Starts at $9.99/month
6. Infogram
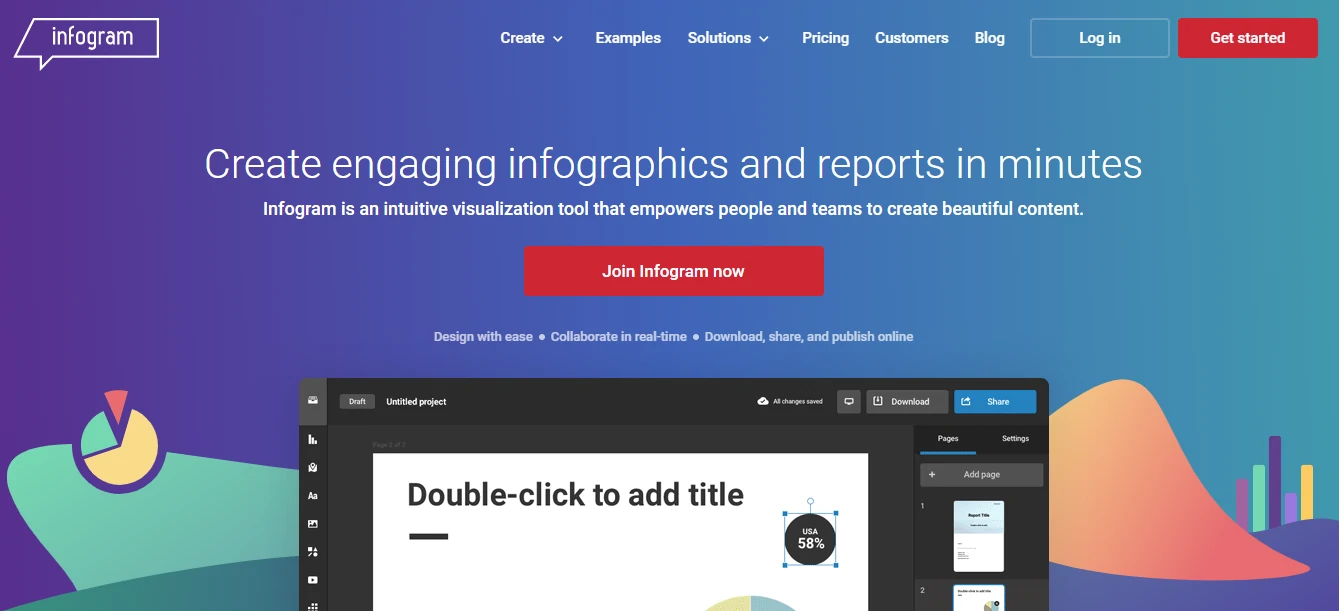
Infogram is ideal for data-driven infographics. It offers advanced charts, real-time data updates, and great sharing options.
Commonly used by marketers, analysts, and journalists, it turns raw data into visuals that are clear, professional, and easy to share or embed.
Pricing:
- Free Plan: Yes
- Pro Plan: Starts at $19/month
- Business Plan: $67/month
7. Snappa
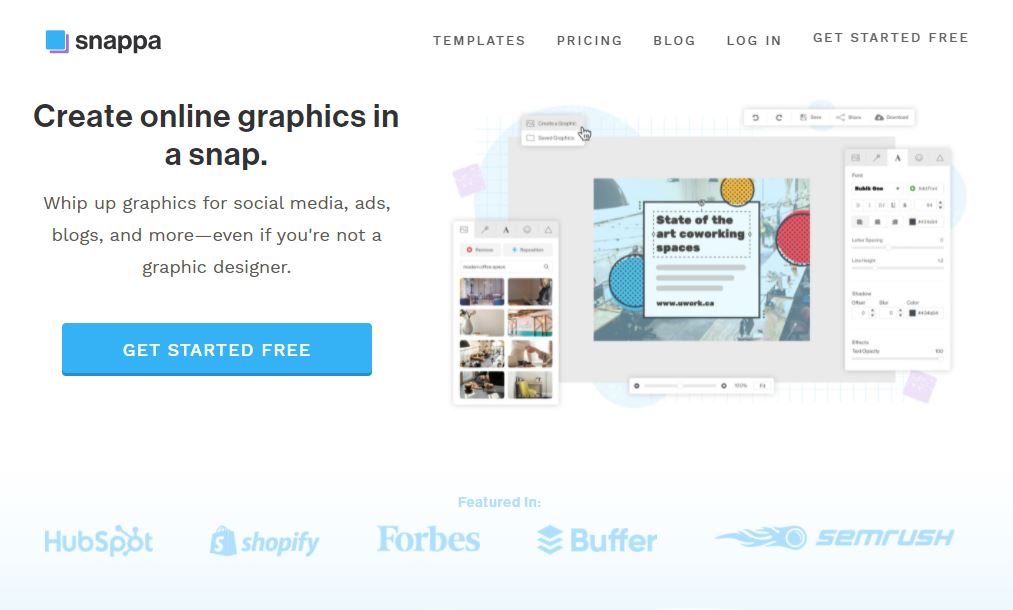
Snappa is a fast and simple design tool made for marketers and bloggers. While not focused only on infographics, it still offers enough templates and elements to create clean, sharp designs without hassle. Great for quick visuals with minimal effort.
Pricing:
- Free Plan: Yes
- Pro Plan: Starts at $10/month
8. Easel.ly
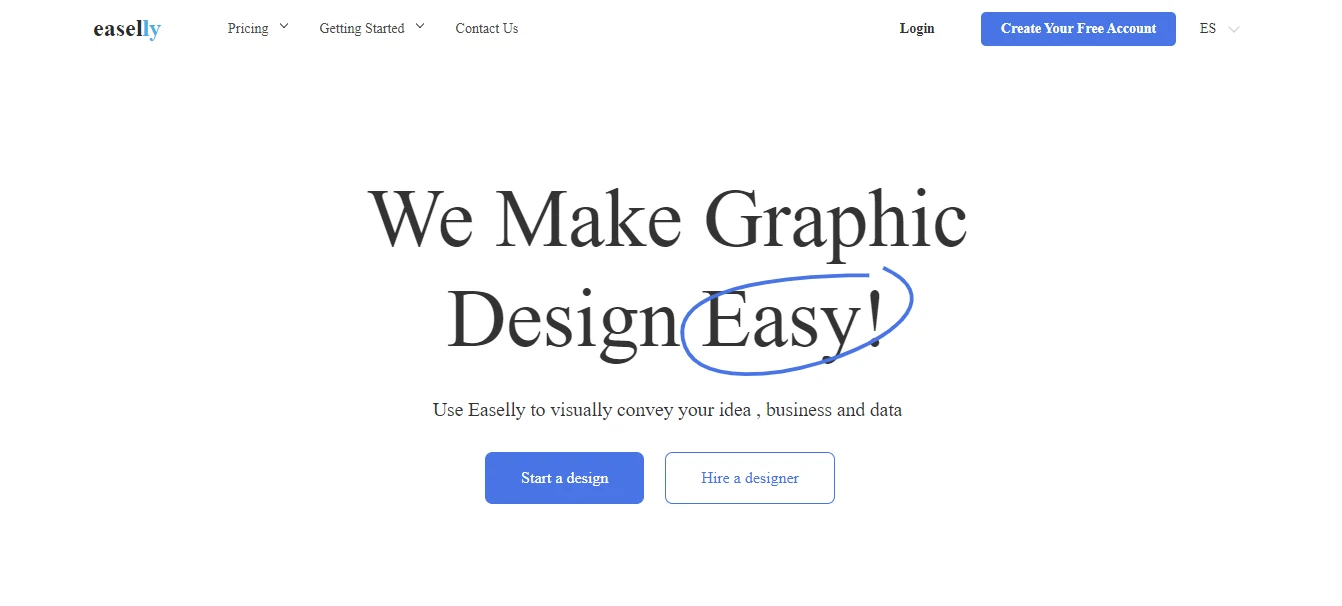
Easel.ly is a simple infographic maker great for students, teachers, and small businesses. It offers basic templates and drag-and-drop tools to help you create visual stories fast.
Perfect for educational or small-scale visual content without the need for complex features.
Pricing:
- Free Plan: Yes
- Pro Plan: $5/month
9. Mind the Graph
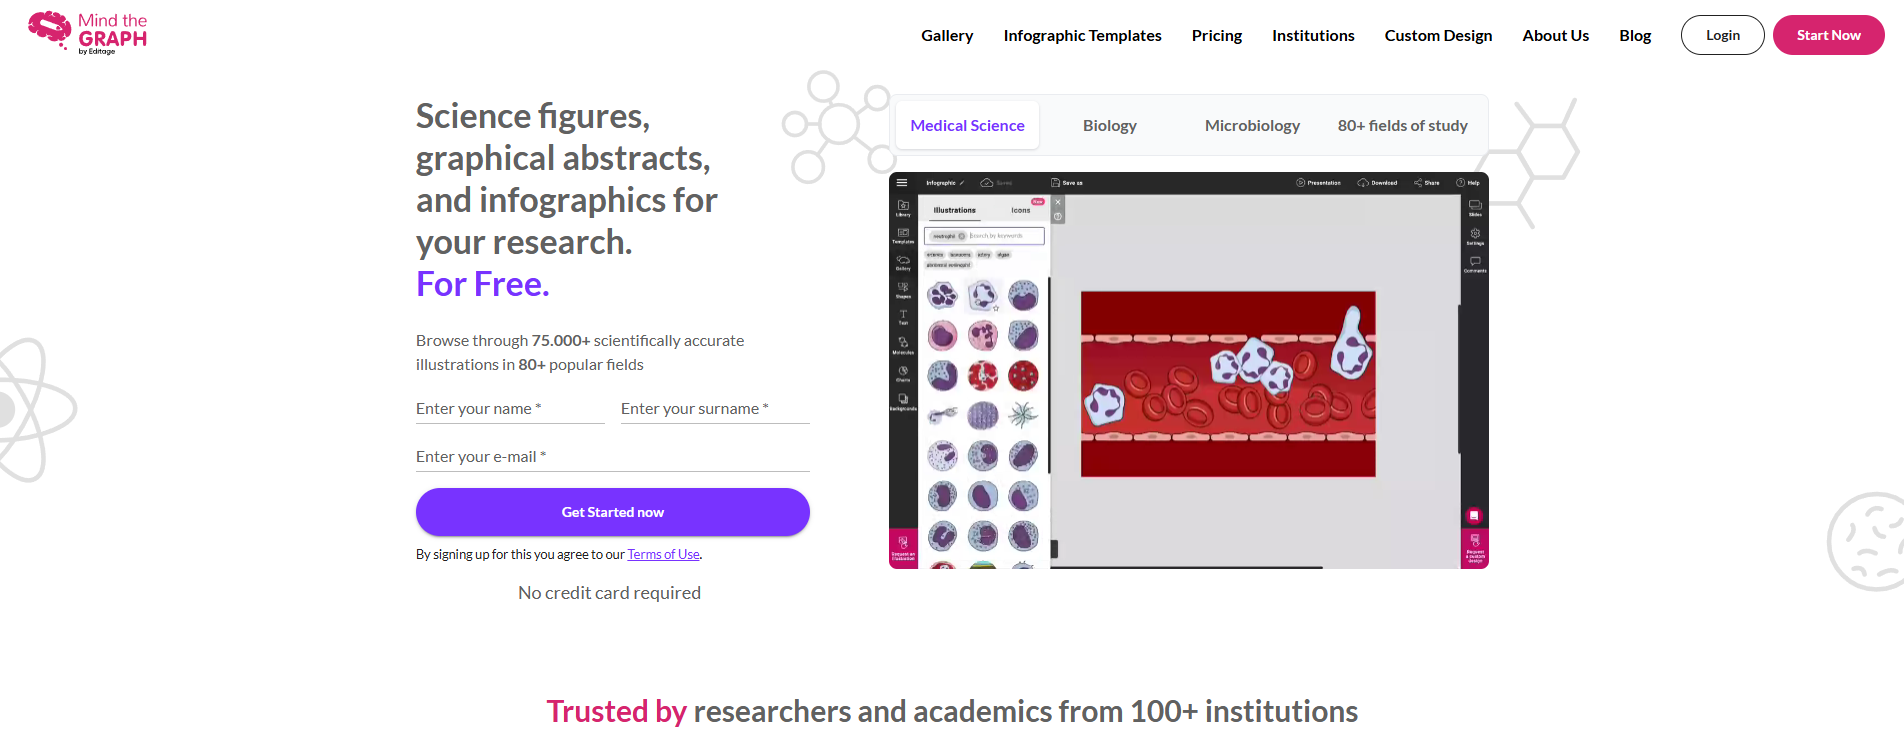
Mind the Graph is designed for scientific infographics. It’s widely used by researchers and educators for creating visual abstracts, posters, and journal graphics.
The platform includes scientific illustrations and templates tailored to academic topics, making complex research visually engaging.
Pricing:
- Free Plan: Yes
- Premium Plan: Starts at $9/month
10. DesignCap
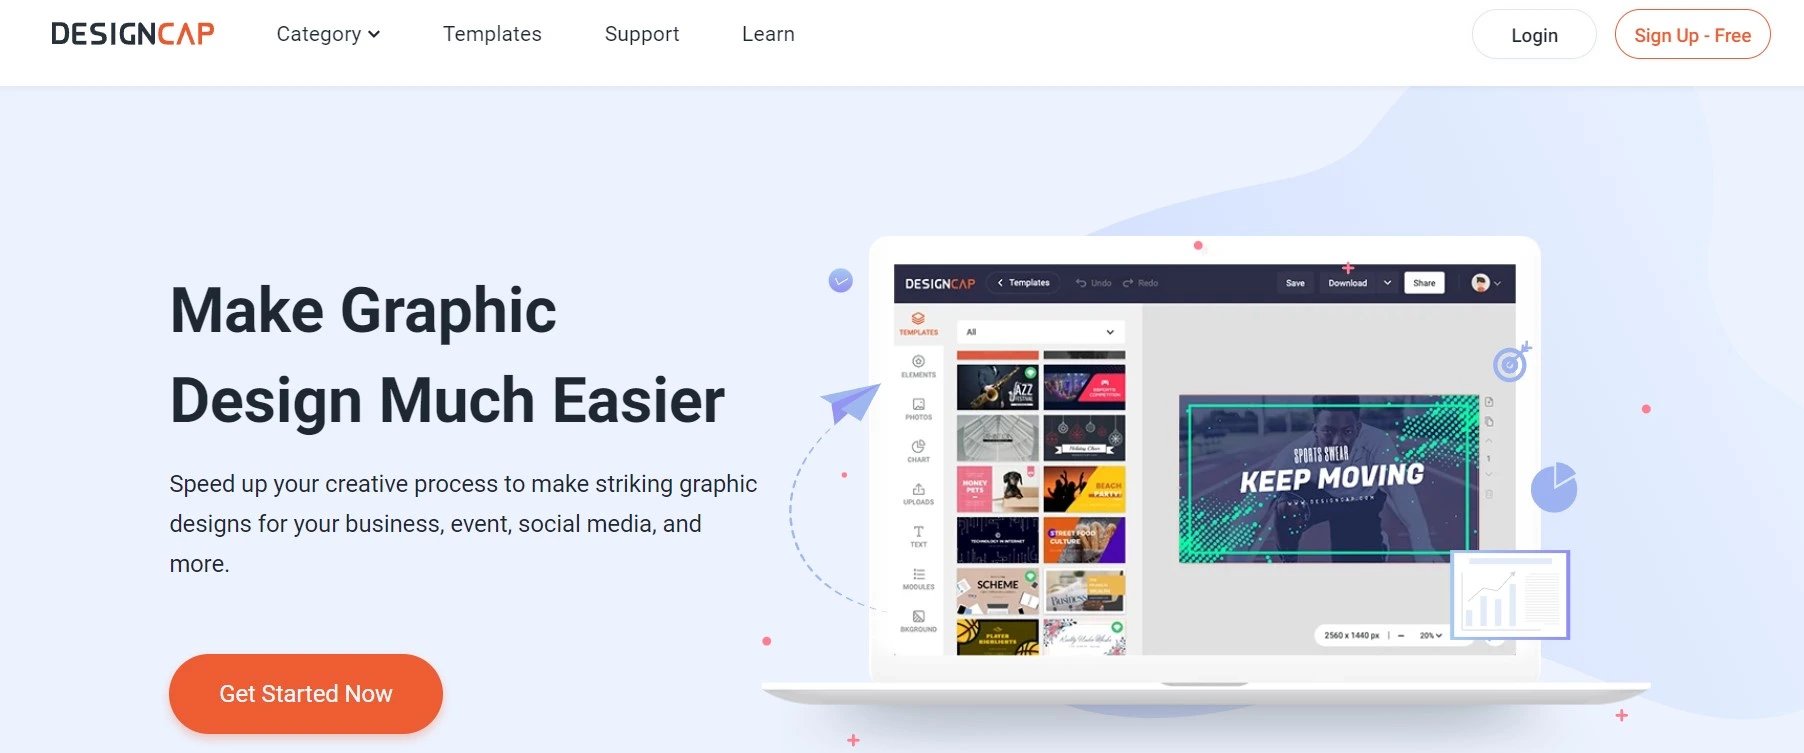
DesignCap is an easy-to-use, web-based tool that offers templates for infographics, flyers, posters, and more.
It’s great for small businesses, educators, and anyone needing fast, effective designs. No sign-up is required to start, and the interface is simple and intuitive.
Pricing:
- Free Plan: Yes
- Basic Plan: Starts at $4.99/month
- Plus Plan: $5.99/month
Tips for Creating Stunning Infographics
Creating a beautiful infographic isn’t just about using the right tool — it’s also about using the right approach. Here are some easy and effective tips to help you design infographics that grab attention and make your message stick:
1. Keep It Simple
Don’t overload your infographic with too much text or visuals. Stick to one main idea or message. The goal is to make complex information easy to understand — not to cram in everything you know.
2. Use a Clear Layout
Organize your content in a logical way. Use sections, headings, and spacing to guide the viewer’s eye from top to bottom. A good layout makes your infographic easier to read and more visually appealing.
3. Choose the Right Colors
Stick to 2–3 main colors that match your brand or message. Use contrast to highlight key points. Avoid using too many colors — it can make your design look messy and confusing.
4. Pick Easy-to-Read Fonts
Use clean, simple fonts that are easy to read at a glance. Avoid using more than two font styles in one design. Consistency helps your infographic look professional.
5. Use Icons and Visuals Wisely
Icons, images, and illustrations make your infographic more engaging. But don’t overdo it — use visuals to support your message, not distract from it.
6. Stick to Data That Matters
Only include important stats and facts that support your message. If you’re using charts or graphs, make sure they’re accurate and easy to understand. Visualizing the right data is what makes infographics powerful.
7. Add a Strong Headline
Your headline is the first thing people see. Make it catchy and clear so readers immediately know what the infographic is about.
8. Include Branding (If Needed)
If you’re creating the infographic for your business, don’t forget to include your logo, website, or social media handle — but keep it subtle so it doesn’t overpower the design.
9. Test Before Sharing
Always take a step back and look at your infographic as a viewer. Is it easy to follow? Is it too crowded? Share it with a friend or teammate for feedback before publishing.
10. Make It Shareable
Use the right dimensions for social media, blogs, or print. Save your infographic in high resolution, and choose a file format (like PNG or PDF) that works well across platforms.
FAQs
What is an infographic maker tool?
An infographic maker helps create visual content like charts, diagrams, and data visuals using templates, icons, and drag-and-drop tools—ideal for simplifying information and engaging your audience.
Which is the best free infographic maker?
Canva is a top free infographic tool offering user-friendly design, templates, and flexibility. Piktochart, Venngage, and Adobe Express also provide great features with limited free access.
Can I create professional infographics without design experience?
Yes, most tools like Canva, Snappa, and Visme offer templates and drag-and-drop editors, making it easy to design professional infographics without prior graphic design skills.
Are infographic makers suitable for business use?
Absolutely. Infographic makers are great for marketing, reports, and presentations. Many tools offer branding, collaboration, and export features for business and team environments.
What features should I look for in an infographic maker tool?
Look for templates, charts, icons, drag-and-drop design, high-resolution export, branding tools, and data import support. These features make the tool versatile and user-friendly.
Is there an infographic maker with real-time data integration?
Yes, Infogram supports real-time data updates and integrations with spreadsheets, making it perfect for dashboards, reports, and data-driven visual content.
Can I download my infographic in high resolution?
Most infographic tools offer high-resolution downloads in PNG, JPEG, or PDF formats. However, some require a paid plan for full export quality.
Can I use infographic tools for social media posts?
Yes, tools like Canva and Snappa offer social media-sized templates, making it easy to design infographics tailored for Instagram, Facebook, and other platforms.
Conclusion
Infographics are a great way to catch attention and share information clearly. Whether you’re new to design or working in marketing, teaching, or business, the right tool can make things much easier. From free options like Canva to data-focused tools like Infogram and science-friendly ones like Mind the Graph, there’s something for everyone.
Pick a tool that suits your needs, keep your design simple, and focus on your main message. A well-made infographic can help people understand your content and remember it too.


